
Alfano News Blog
Welcome to our News Blog.
Keep up to date with the latest products from Alfano and RG Racing.
Internal Tyre Pressure and Temperatures
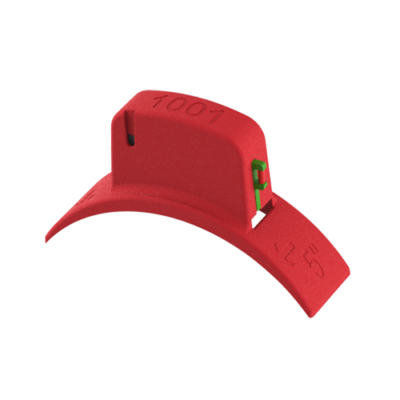
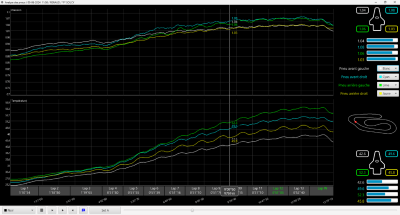
Do you know what's happening to your tyres when you are on track?
We we can help there. The Alfano Internal Tyre Pressure and Temperature Sensors are ideal to se live changes to your temps and pressure. Ideal for that test day when you can set different pressure to each tyre before going on track and seeing the changes to tyre temps and pressures for each part of the track.
Fitting is easy. Fit inside the wheel using a band supplies by Alfano or a wide cable tie. The sensor sits opposite the valve. You will need to balance the wheel once the tyre is fitted. The Alfano dash can work with 2 sets of sensors (Set A and B) This can be 2 sensors per set for and bike or 4 sensors per set for a kart or car.
What do you see?
- Hot pressure – set cold pressures so the tyres reach your target hot pressure – no more guessing in parc ferme.
- Warm-up – how many laps before the tyres are in the correct working window.
- Balance – left vs right and front vs rear tell you how the chassis is loading the tyres
How do you see it?
On the Dash Display – By pressing a button the dash will display the data
In the Software – Using the ADA or ADA Pro Software you can see when and where the temps and pressures change allowing you to set the pressure up for each session.
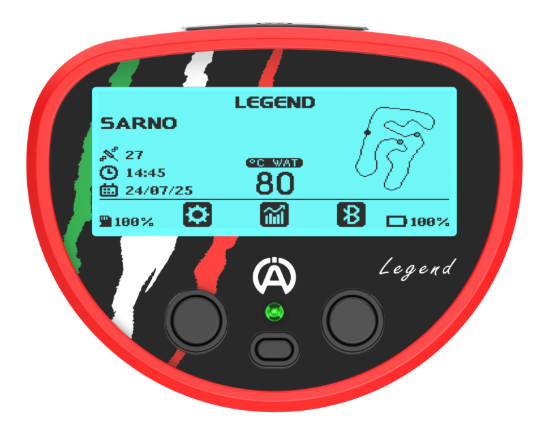
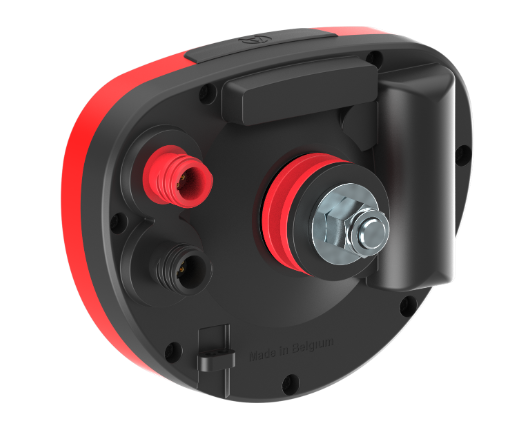
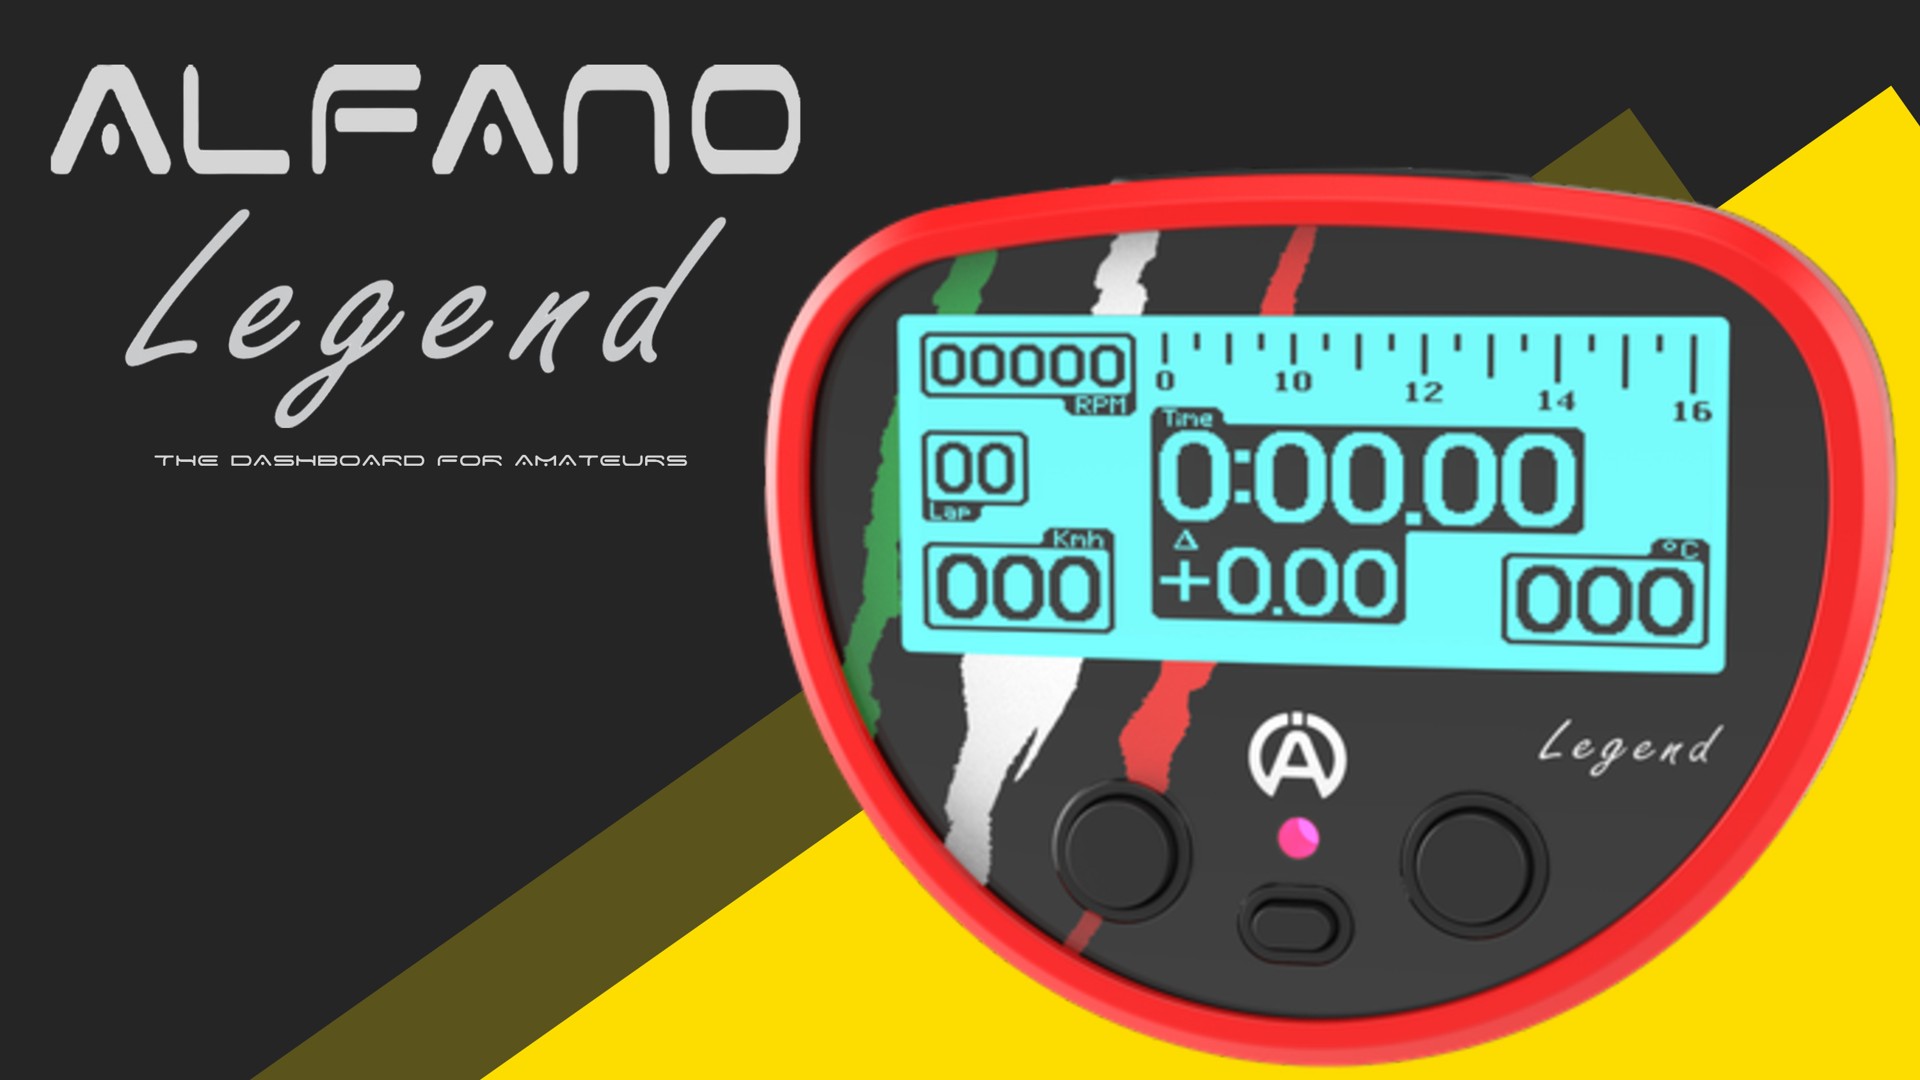
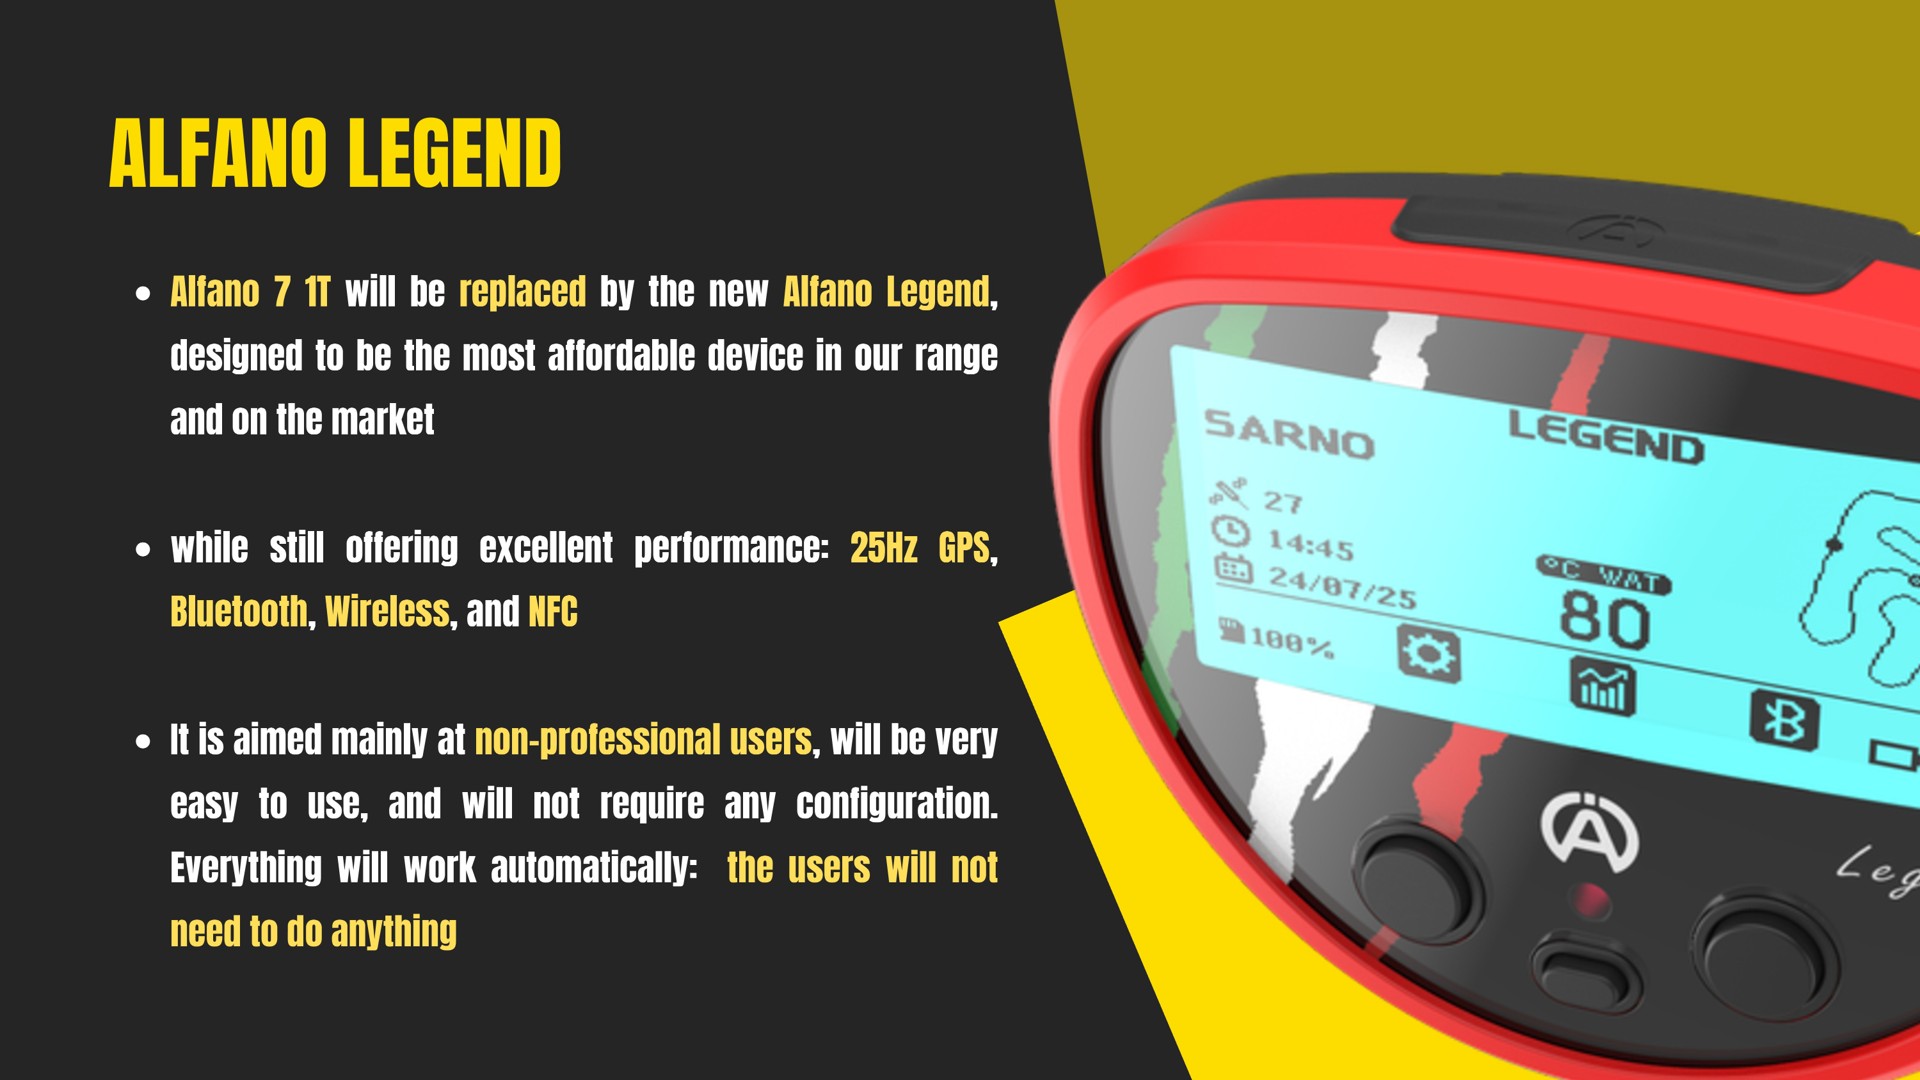
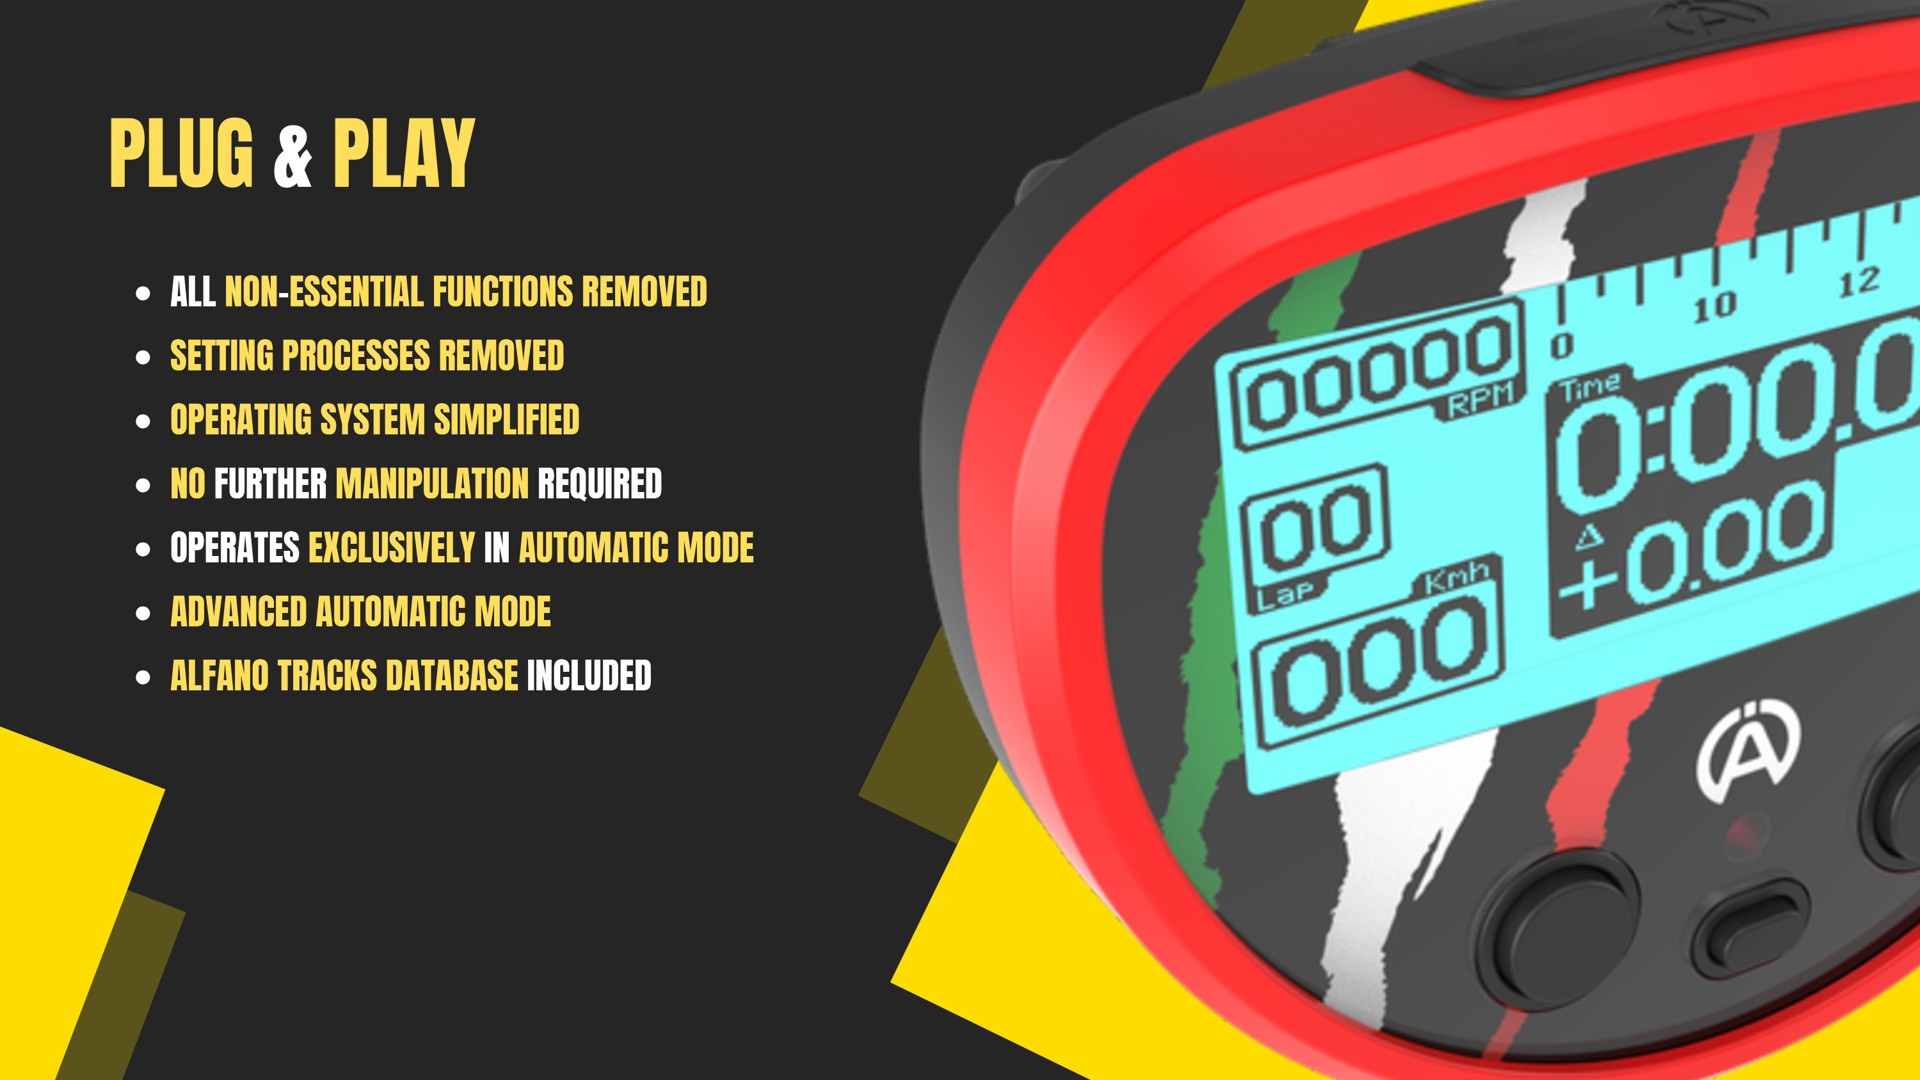
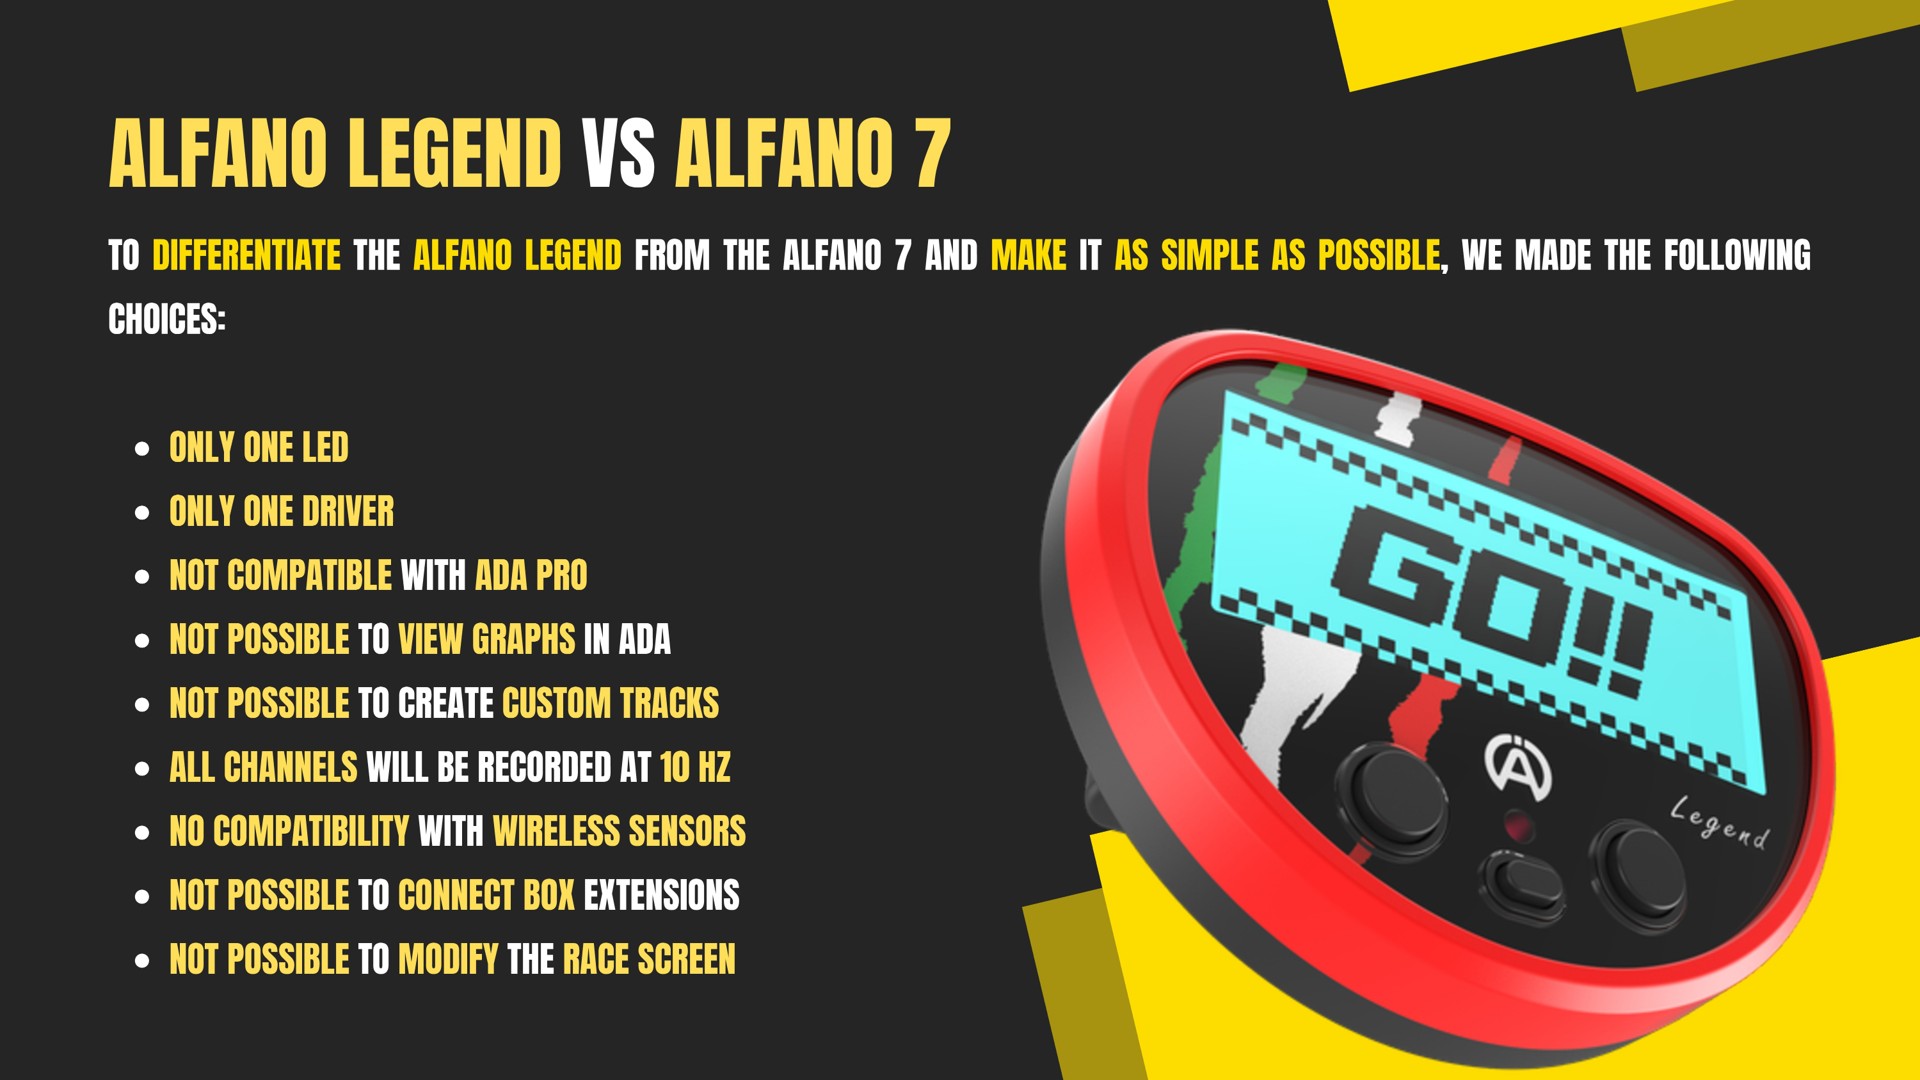
The Legend Returns
---------------------------------------------------------------------
Jan 2024
ADA-PRO: The Essential Tool for Motorsport Engineers
With ADA-PRO, our intuitive and powerful
software allows you to analyse your driving and vehicle behaviour in detail,
helping you identify strengths and areas for improvement. This enables you to
make informed decisions to optimise performance.
ADA-PRO offers a complete range of data for
performance analysis, from basic parameters such as speed and RPM to
more advanced metrics including G-force, lambda readings, pedal
movement, steering wheel movement, exhaust temperatures, and tyre pressures and
temperatures.
The software provides clear graphical and numerical visualisation, making complex data easy to interpret. For advanced users, mathematical channels are available, offering an invaluable tool for fast and precise data analysis.
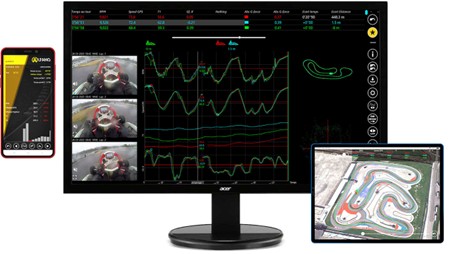
ADA-PRO provides the ability to have pop out screens to place on a second monitor allowing more visual debriefs with drivers and team personal. Pre Programmed mathematical channels for quick accurate data for when .
Download the ADA Apps for Free
- ADA PRO for Windows – Pro Version for Windows users.
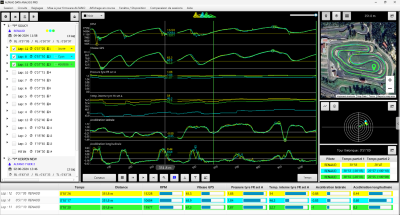
RPM + LAMBDA LSU 4.9
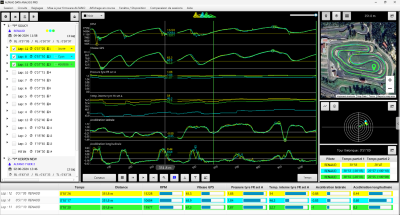
Tire pressures and temperatures (internal) for the entire session.
----------------------------------------------------------------
ALFANO DATA ANALYSIS (ADA)
The ADA software is ideal for the club racers with built in analytic graphs and simple settings. The user interface is the same across the Phone, Tablet and Windows software so easy to jump between the tools and devices. Our new intuitive and powerful software enables you to analyse your driving and vehicle behaviour in depth, helping you identify strengths and areas for improvement. MORE INFO
Download the ADA Apps for Free
- ADA
for Windows – Standard version for Windows users.
- ADA
for Android – Available on the Google Play Store.
- ADA
for iOS – Available on the Apple App Store.
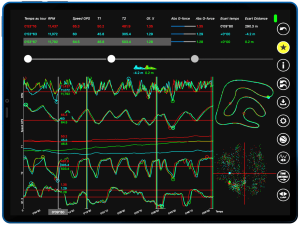
Analyses' Screen Showing overlays
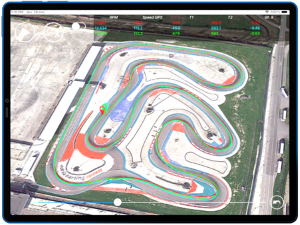
Analyses' Map showing lines per lap selected
Key Features
- RPM
+ LAMBDA LSU 4.9 Analysis – Monitor engine performance with high
accuracy.
- Tyre
Pressures and Temperatures – Track internal tyre metrics
throughout sessions.
- Session
Management – Organise and filter sessions by date,
driver, circuit, or category.
- Circuit
Database – Access a comprehensive database of circuits, viewable
on platforms like Google Earth.
- RPM
Analysis – Examine engine RPM, adjust amplitude, view
acceleration/deceleration zones, and customise visual elements.
- Gearbox
Analysis – Analyse gearbox performance, modify display settings,
and focus on specific driving phases.
- Graphical
Lap Analysis – Visualise sensor data, track layouts, G-force,
and lap comparisons with zoom and parameter insertion
capabilities.
- Engine
Power Analysis – Display engine power as histogram graphs,
compare RPM and speed acceleration, and identify acceleration
zones on the track.
There are no products to list in this category.